Showing posts with label visualizations. Show all posts

Sunday, December 2, 2012

Find: Good idea - Music Hack Day project maps out lyrics to Johnny Cash's 'I've Been Everywhere' in realtime

Music Hack Day project maps out lyrics to Johnny Cash's 'I've Been Everywhere' in realtime

Cash I've Been Everywhere

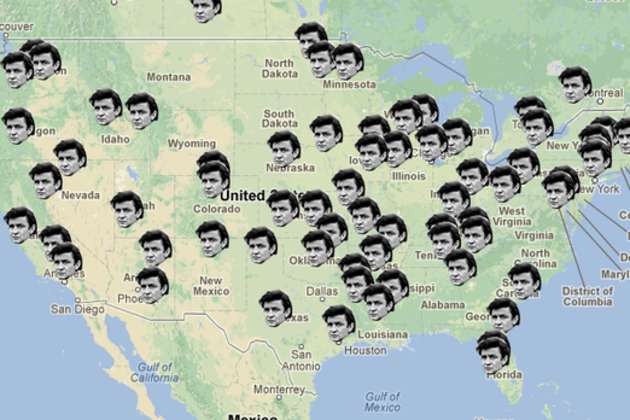
In 1996, the legendary Johnny Cash recorded "I've Been Everywhere," putting his signature on an old-time country classic. The song, which rattles off dozens of locations throughout North America, was an appropriate fit a musician that toured rigorously throughout his storied career. Now through the magic of Google Maps, you can listen to the song while each one of those destinations is labeled with a Johnny Cash pin — all in realtime before your own eyes. Developer Iain Mullan whipped the project together for Music Hack Day London 2012 using MusixMatch (for lyrics), Toma HK and his own programming know-how. In all, mapping out "I've Been Everywhere"'s itinerary results in 112515 miles of travel. Cash undoubtedly crossed through many of...

Wednesday, August 15, 2012

Find: visualizing the evolution of the web

Behind the scenes: visualizing the evolution of the web

Dero

Sergio

This guest post is by Sergio Alvarez, Vizzuality, and Deroy Peraza, Hyperakt, in collaboration with Min Li Chan, Chrome Team

At Google I/O this year, we launched a new version of The Evolution of the Web, a project visualizing the history and pace of innovation in web technologies and browsers. The Evolution of the Web traces how web technologies have evolved in the last two decades and highlights the web community’s continuous efforts to improve the web platform and enable developers to create new generations of immersive web experiences. In collaboration with the Google Chrome team, the team at Hyperakt designed the interactive visualization while Vizzuality built it using HTML5, SVG, and CSS3.

The visualization included 43 web technology "strands" across 7 browser timelines to represent major developments on the web platform. On hover or tap, each strand is highlighted to reveal intersections that tell the story of when browser support was implemented for each new web technology. To provide additional context, we developed a secondary visualization to illustrate the growth of Internet users and traffic.