Folks,
Our best effort grades are up! Please have a look and let us know if you see any problems.
Changes from here on out should be few.
Professor Watson.
Wednesday, December 16, 2015
Monday, December 14, 2015
Peer Evaluations
Hi folks,
Peer evaluations are available here, if you wish to evaluate your team members. You are not required to do this.
Have a good break!
Peer evaluations are available here, if you wish to evaluate your team members. You are not required to do this.
Have a good break!
Friday, December 11, 2015
Project: Nonlinear Learning

Problem:
One of the main focuses of our nonlinear learning project was to incorporate mind maps for nonlinear learning, and use p5.js for videos with interactive elements. We spent over 2 months exploring the different aspects of the Go.Js library (mind map) and the p5.js library (interactive videos), and this report will highlight our findings and opinions.
Description:
Linear learning, as found on course sites such as moodle exhibit a very rigid type of learning, where people go from topic A to B, then to C. Nonlinear learning allows students to navigate through different topics at their leisure, while providing the instructor the tools to guide them in the right direction.
Future Work:
- Add more immersive elements to mindmap (different sounds for different actions)
- Allowing mindmap changes to be directly saved to the html file
- More tools for instructors who are not proficient with coding (interfaces for non-technical users)
- Incorporating whole course web pages into mindmap (moodle)
- Tracker for most visited videos, favorites list
Video Demo:
Our Site:
Github Repo:
Presentation:
User Feedback and Evaluations:https://docs.google.com/a/ncsu.edu/document/d/1qWz3rIN9NmhkNBTscGFsn3sd3XueZmyHnAjNo035auE/edit?usp=sharing
Report of Go.Js and p5.js utility
https://docs.google.com/a/ncsu.edu/document/d/18zXQo68JWzYhsgQ6l_rAoa0ejuyf66Q71dAjPp3UQrU/edit?usp=sharing
User Manual:
https://docs.google.com/a/ncsu.edu/document/d/1hP5OV1aaaPVSeOUxbJvpHkBmrcdDOwVwyZh-TxC8ZRs/edit?usp=sharing
orites list
Project FuturePres Team 2

Team Members:
- James Davis
- Michael Ivanov
- John Nixon
- Benjamin Drury
- Alexander Richardson
- Quinton Chappell
Problem:
Creating a new way to present a presentation in a non-linear model to make presentations more intuitive and exciting.
Description:
Presentations follow a linear path from one slide of information to the next which offers very little flexibility for the presenter and can also be dull for its audience. The idea of FuturePres is to create a new way to present data in a non-linear model to improve the experience of presentations for the presenter and his/her audience. For our implementation we focused on legal cases where lawyers have to record data and present them in a court of law. The website is split into four different categories: People, Places, Evidence, and Events. These are used to store the data from cases into the sstem to represent later. Once Data is stored onto the system the data is linked from one to another by connecting factors of other categories. Using this the presenter can move from one piece of data to the next by simply clicking on a connecting factor and guide the presentation. A timeline is also implemented in the View section to show events on a day to day, week by week, or even year by year selection.
Future Work:
- Extra Features
- Comments
- User log ins
- Data Collection/Database expansion
Video Demo
Presentation
Demo Server
GitHub Repository
Projects: Tilt-A-Story
Tilt-A-Story Project Description

Tagline:
Tilt-a-story is an interactive picture book to inspire children to read.
Core Problem:
Children today no longer read books. Instead, they spend most of their time glued to their phone and ipads. By introducing classic childhood stories and fun learning games, children that use our program will be able to embrace the same learning that comes from reading books. The best part is, they think they’re just playing a fun game!
How it Works:
To make Tilt-A-Story we used javascript, canvas and html. By using these tools our webpage can run on more browsers. The child can interact with the story in two ways. The first way is to tilt the device to move the character around the screen. The second way is by using the touch screen to press buttons. Both methods can be mixed and matched as needed by the story writer/designer.
Future Work:
In the future we plan to increase the user experience by adding more sounds and animations. We would like to add gifs instead of static pictures to increase the overall visual of the app. Since Tilt a story brings together multiple stories for children to learn from, we need a way for parents to “buy” a story and add it to the application. We would also like to create a “world builder” application so that designers can easily create their own stories and post them to our store.
Extra Credit:
On top of our completed Picnic Adventure story, we have also finished our Billy’s Treasure Hunt story that capitalized more on telling a story with visuals. The player takes on the role of Billy and his search for treasure, along with picking up useful tools along the way.
- A link to the working site
- Video
- Github Repo
- Presentation
- Project Evaluation
Project: Sharks
Citizen Science - An initiative to enable everyone to participate in a scientific process.
Problem:
We would like to provide students the opportunity to experience the process of finding, measuring, and doing statistics on shark teeth, without needing to acquire expensive supplies. We want to create a "virtual fossil dig" which will allow students to get a similar experience by through their browser.How it Works:
From the homepage, users can click on the "Start Digging!" button to be directed to the main game panel. 15 Shark teeth will be randomly scattered across a background of "fossil dirt." Not all of the dig area is visible at once, so users will need to scroll around using the arrow keys or scrollbars. Once a user sees a tooth, they can click it, at which point it will disappear from the game window and reappear in an inventory panel. Once all 15 teeth have been discovered, the user can progress to a measurement page where they try to fit each tooth into the smallest circle that completely encloses it. Once all teeth have been measured, the user progresses to a statistics page, where the size distribution of the teeth they have measured is compared against the size distribution of all of the teeth in the database.Future Work:
- Add an "I give up" button which highlights remaining teeth so that they can be found
- Zoom in/out functionality
- Better interface
- More backgrounds
- Provide more information about the shark teeth and sharks they came from
- Class / group functionality - compare your teeth statistics against the entire class
Demo Site
Screencast
Presentation
Github
Created By:
Remington Campbell, William Pruett, Eric Anderson, Daniel Alley, Kevin Reed, Derek Schreiner
Project: Seniors
Resources for Seniors, Inc
Accessible information for Senior Citizens at a click of a button

Problem:
In order to best cater to the needs of a growing Senior Citizen presence in North Carolina, the Resources for Seniors, Inc website was redesigned in order to accommodate additional functionality and facilitate the process for users to view, save and print information about companies related to their interests.
Description:
Resources for Seniors serves senior and disabled adults in Wake County, NC, by providing home and community-based services and information so that they can maximize their choices for independence, comfort, safety, security and well-being. We provide information and support for decision-making, and also direct services such as home care, adult day care, senior centers, home repair, and more. We are committed to excellence in service and care for individuals and their families. In particular, the project listed here allows web access to all information that Resources for Seniors, Inc provides in a user friendly, intuitive manor on a variety of devices.
Future Work:
- Frequent updates of Company information on the Webpages
- Deployment of new PHP stack onto the Web Server
Video:
Demo Server:
Presentation:
Eric Bolender, Thomas Boop, Arthur Harris, Robert Lodico, Jacob Rose, Miles Wells
Thursday, December 10, 2015
Project: SAS Team Two

CSC 342 Sas Team 2 Project Description
TagLine:
Web application demonstrating different ways to animate the transition between data and a graph.
Problem to solve: Transitions from data to graphs are often clunky and hard to follow, if they even exist at all. The goal of this web app is to demonstrates ways for these transitions that are smooth and easy to follow.
How it works:
This application used a simple user interface consisting of an area for the data and an area for the graph. It also has a side bar that allow the user to choose which type of animation and transition to display.
Most of the transitions are done with the animate function in jquery, where we can decide where to move elements and how much to expand or compress them. The data for the demo is coded in an array for ease of access. Also, we used p5.js for our pie and doughnut chart. And finally, the animations themselves are done with a setInterval function to make all the timing work out properly.
Unfinished and future work:
-Finding ways to transition to other types of graphs.
-Implementing the transitions with larger data sets
- Being able to upload your own data set
- Coming up with different animation styles
Link to site:
http://www4.ncsu.edu/~tcpatter/csc342/
Presentation
https://docs.google.com/presentation/d/1Z0bY3n2lwsVa_rwYfxaKMv-run7NtjxVgsCO20nUo2Y/edit#slide=id.gec04617d4_0_53
Video
https://www.youtube.com/watch?v=1gElNyBlpyg
GitHub:
https://github.com/NCSUWebClass/fall15-sasgraphs2
Michael MacKrell, James Schaefer, Connor Patterson, Jose Chavez, Philip Jones
Project: CodeArt
LENT - A project that turns library technology into art.
Problem:
How to combine useful data about Hunt Library's Tech-Lending resources with digital art and sound.Description:
A project to turn library technology into art. Users are able to see a visual representation of the technology that is currently available to be checked out at Hunt library in the Immersion Theatre. On the left is a legend that allows the user to see how many of each item is currently checked out, as well as a key that shows what each shape in the visualizer represents. On the right is the visualizer - a unique way to display the data about what technology is currently available and checked out from the library. The purpose of the project is to find a way combine a useful data with art, as part of NCSU Hunt Library's CodeArt Competition.Future Work:
- System Testing within the Immersion Theatre
- For every 10 or so minutes, allow each individual sound to provide a "roll-call" along side an animation, so that viewers could see which object is associated to which device
- Convert 3D objects to three.js
- Allow the aesthetics of the visuals and sound to change depending on the time of the day
- Update the "Castle" so that we have different variations showing up on the map
- Add Camera/Tilt Perspective to the map space
- Change mechanism in which the chart is currently being loaded, so that a Timout doesn't need to be used
- Allow extendability with loading objects, for easy inclusion of new devices
Link to Video
Link to Live Working Demo
Link to Presentation
GitHub:
http://go.ncsu.edu/codeartlentCreated By: Cameren Dolecheck, Tori Santonil, Filip Kolev, Zane Hissom, Nicholli Bernard, Kamaria Hardy
Spiral Sleepwalker
Project: Spiral Sleepwalker

Team members: Abbey Lancaster, Aoyi Li, Kai Ma, Nicholas Waked, Ethan Swartzentruber and Jennifer Wagman
Tagline: Gravity-Based Mobile Platformer
Problem:
Developing a web based mobile game that reads data from motion sensors on smartphone or tablet.
Implementation:
We wanted to create a native mobile game experience while the user was actually playing a web based mobile game. We used p5.js to implement all of the game's graphics, including a gravity oriented mechanism that allowed the user to manipulate the sleepwalker in the game. Various levels are implemented, with varying amounts of difficulty. The amount of monsters increases as the player moves to higher levels, and the maps become more difficult to navigate.
Future/Unfinished Work:
The game still has extreme performance issues on Android, we expect that switching libraries would make this better.
Implementing more levels
Developing a tool for non-programmers to create levels
Links:
Link to Working Site
Link to GitHub
Link to Video
Wednesday, December 9, 2015
Friday's NexUX meetup with Emil Polyak - 3:30pm at Hunt Library!
As before, 1% extra credit for coming.
Unfortunately we could not swing the beer yet. As you might imagine, there is some bureaucracy :-(
Webclass, we'll just be a bit late in arriving.
|


Tuesday, December 8, 2015
Announcement (updated): Python, advanced tools and visuals quizzes are up! Do them by Thursday
Updated: I've turned them on! Apologies, force of habit.
Python, advanced tools, and visuals quizzes are up! These are optional, but we've already had ten quizzes, so taking these can only improve your grade.
Finish them by end Thursday the 10th.
Professor Watson
Python, advanced tools, and visuals quizzes are up! These are optional, but we've already had ten quizzes, so taking these can only improve your grade.
Finish them by end Thursday the 10th.
Professor Watson
Sunday, December 6, 2015
Find: A major internet backbone company is about to make a lot of websites load much faster
A major internet backbone company is about to make a lot of websites load much faster
// The Verge - All Posts

In February, web engineers released a way to move information over the web. Called HTTP/2, the new protocol is designed to make web traffic faster and more efficient. In the months since it was formally approved, the challenge has been getting the rest of the web to use it.
Today, the protocol is taking a big step forward, thanks to a new deployment from the content distribution network CloudFlare. Starting today, HTTP/2 will be available by default to all the company's customers, more than doubling the adoption for the fledgling web standard. CEO Matthew Prince says the company has been rolling out support for the protocol slowly over the past week, and company scans indicate three out of four sites using HTTP/2 on the Alexa top...
Continue reading…
// The Verge - All Posts
In February, web engineers released a way to move information over the web. Called HTTP/2, the new protocol is designed to make web traffic faster and more efficient. In the months since it was formally approved, the challenge has been getting the rest of the web to use it.
Today, the protocol is taking a big step forward, thanks to a new deployment from the content distribution network CloudFlare. Starting today, HTTP/2 will be available by default to all the company's customers, more than doubling the adoption for the fledgling web standard. CEO Matthew Prince says the company has been rolling out support for the protocol slowly over the past week, and company scans indicate three out of four sites using HTTP/2 on the Alexa top...
Continue reading…
Saturday, December 5, 2015
Find: Internet-connected Hello Barbie doll gets bitten by nasty POODLE crypto bug
Barbie got hacked!
***
Internet-connected Hello Barbie doll gets bitten by nasty POODLE crypto bug
// Ars Technica
 A recent review of the Internet-connected Hello Barbie doll from toymaker Mattel uncovered several red flags. Not only did the toy use a weak authentication mechanism that made it possible for attackers to monitor communications the doll sent to servers, but those servers were also vulnerable to POODLE, an attack disclosed 14 months ago that breaks HTTPS encryption.
// Ars Technica
The dreaded Hello Barbie. (credit: Mattel)
The vulnerabilities, laid out in a report published Friday by security firm Bluebox Labs, are the latest black eye for so-called "Internet of Things" devices. The term is applied to appliances and other everyday devices that are connected to the Internet, supposedly to give them a wider range of capabilities. The Hello Barbie doll is able to hold real-time conversations by uploading the words a child says to a server. Instant processing on the server then allows the doll to provide an appropriate response.
Bluebox researchers uncovered a variety of weaknesses in the iOS and Android app developed by Mattel partner ToyTalk. The apps are used to connect the doll to a nearby Wi-Fi networks. The researchers also reported vulnerabilities in the remote server used to communicate with the doll.
Find: Microsoft to open source Chakra, the JavaScript heart of its Edge browser
Microsoft to open source Chakra, the JavaScript heart of its Edge browser
// Ars Technica
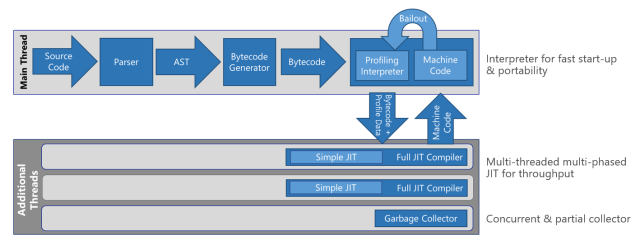
Block diagram of Chakra's design. (credit: Microsoft)
At JSConf in Florida today, Microsoft announced that it is open sourcing Chakra, the JavaScript engine used in its Edge and Internet Explorer browsers. The code will be published to the company's GitHub page next month.
Microsoft is calling the version it's open sourcing ChakraCore. This is the complete JavaScript engine—the parser, the interpreter, the just-in-time compiler, and the garbage collector along with the API used to embed the engine into applications (as used in Edge). This will have the same performance and capabilities, including asm.js and SIMD support, as well as cutting-edge support for new ECMAScript 2015 language features like the version found in Microsoft's Windows 10 browser.
There are some small differences, however, between ChakraCore and Chakra as ships in Windows 10. The full Chakra includes the glue between the JavaScript engine and the browser's HTML engine, and similarly, glue between the JavaScript engine and the Universal Windows Platform. Neither of these are part of ChakraCore. Chakra also has diagnostic APIs that use COM and hence are Windows-specific. These won't be in ChakraCore either. Instead, a new set of diagnostic APIs will be developed and eventually integrated into the full Chakra.
Read 6 remaining paragraphs
// Ars Technica
Block diagram of Chakra's design. (credit: Microsoft)
Microsoft is calling the version it's open sourcing ChakraCore. This is the complete JavaScript engine—the parser, the interpreter, the just-in-time compiler, and the garbage collector along with the API used to embed the engine into applications (as used in Edge). This will have the same performance and capabilities, including asm.js and SIMD support, as well as cutting-edge support for new ECMAScript 2015 language features like the version found in Microsoft's Windows 10 browser.
There are some small differences, however, between ChakraCore and Chakra as ships in Windows 10. The full Chakra includes the glue between the JavaScript engine and the browser's HTML engine, and similarly, glue between the JavaScript engine and the Universal Windows Platform. Neither of these are part of ChakraCore. Chakra also has diagnostic APIs that use COM and hence are Windows-specific. These won't be in ChakraCore either. Instead, a new set of diagnostic APIs will be developed and eventually integrated into the full Chakra.
Wednesday, December 2, 2015
Announcement: project details and our final day
Event: A reminder that projects are due as you present them during our final period, which will happen on Friday December 11, 1-4pm, in our regular room. With ten projects, we will have 18 minutes per presentation. On that day we will be visited by most of our clients. SAS and Lexis Nexis have indicated that they would prefer to come to this final period rather than host you at their facilities.
Deliverables: In addition to your presentation, you should prepare the deliverables outlined on this page. Some notes:
Presentation: And here is a reminder of how to present.
Professor Watson
Deliverables: In addition to your presentation, you should prepare the deliverables outlined on this page. Some notes:
- To post, you will need authoring rights on our class site. To get those rights, each team should have at least one of its members contact our TA, then accept the resulting invitation.
- There are many screencasting tools, but my preferred tool now is Google Hangouts on Air, which does not require any install. Just do a private broadcast to yourself only, and it will appear in your YouTube. You can even do a little editing there.
- Host your working site on your assigned github repo, if it is all client side. If you have server side components, we suggest AWS or Google Cloud -- both have free options.
Presentation: And here is a reminder of how to present.
Professor Watson
Announcement: grading update
Folks,
One of you pointed out that the comments headings in the wolfware grading feedback were not informative enough. We improved them.
Also, we added project grades to date.
We have not yet graded assignments (questions) and critiques.
Although today is our last class, we will do our best to respond quickly to your project and grading concerns until the final.
Professor Watson
A primer on Python CGI Programming
This should be useful to those of you who haven't already finished this Friday's homework. It describes how to connect your python script to an http/html request through cgi.
Professor Watson
Announcement: reminder about today's office hours @ 1145
With the semester winding down, I thought I would remind you about my office hours today, at the usual place and time:
- when: 1145am
- where: eb2 2280
I would be happy to meet with you outside this time if you have any other concerns.
Best,
Ben.
Subscribe to:
Posts (Atom)