// published on The Verge - All Posts // visit site
Interactive map turns Dutch construction trends into epic graphics
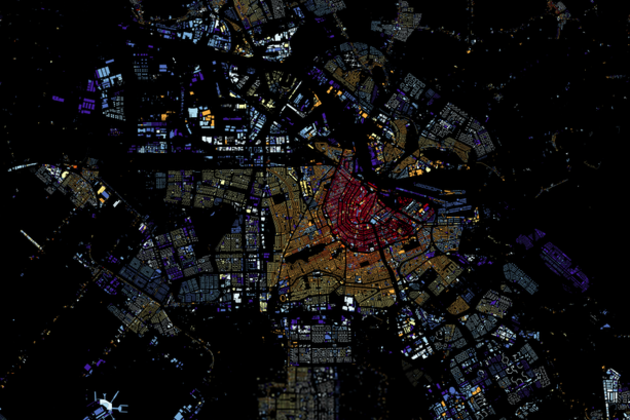
Plotting out the 320,000-plus buildings in Brooklyn and shading them according to their year of construction was a painstaking labor of love by Thomas Rhiel. And now his idea is going even bigger. Nearly 10 million buildings in the Netherlands — 9,866,539 to be exact — have been given the same treatment. Set to a black background, the hues of red, yellow, and blue that outline buildings vary depending on how long each has been standing. Much like Brooklyn, architecture of the Netherlands is a mix of old and new, but the sheer scale here is extraordinary and something to marvel. Clicking on an individual building will display its size, function (i.e. office, school, etc.) and year it was constructed. And since the tool pulls...
No comments:
Post a Comment